- All
- Product Name
- Product Keyword
- Product Model
- Product Summary
- Product Description
- Multi Field Search
 |


KDSI Also can do OEM
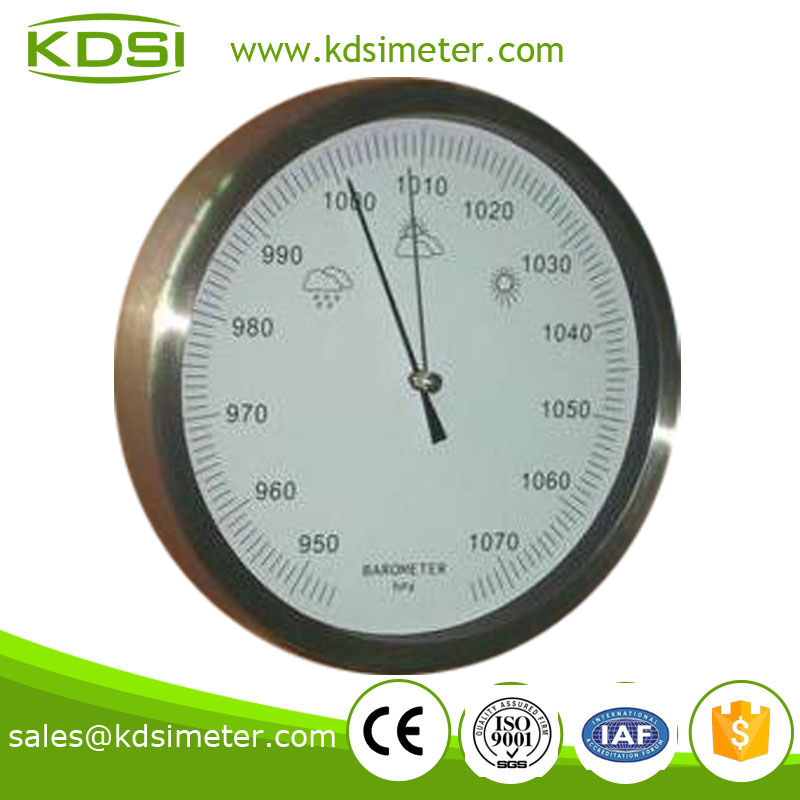
| Model | Size | Range | Accuracy | Weight | Packing |
| B9200 | DIA200mm*TH40mm | 970~1070hPa | +/-5hPa (980~1040hPa) | 0.45KG | White box package |
| Atmospheric pressure can represent the air density at the different height levels of the Earth’s surface. It is generally divided into low pressure and high pressure according to the value of the air density. Just like water following from the higher place to the lower place, the air also follows from the high pressure area to the low pressure area. At the low pressure area, there is a lot of water vapor that will cause clouds or rain, so bad weather is caused by the low pressure and by contrary, the weather becoming better is due to high pressure. On a barometer, the high pressure and low pressure are relative, and there is no a clear boundary. However, we can use the 1000hPa as boundary, the left of which is low pressure area and the right of which is the high pressure area. You can simply mark the then atmospheric pressure and observe its changes by using the adjustable hand on the barometer’s lens. You shall read at least once a day and record the frequency of changes in air pressure. Reading several times a day can get an accurate weather forecast. Although there are many factors having the actual impact on the weather, such as geographical location, temperature, humidity, wind direction and season. However, by observing the change in atmospheric pressure, you can do weather forecast yourself. | |||||